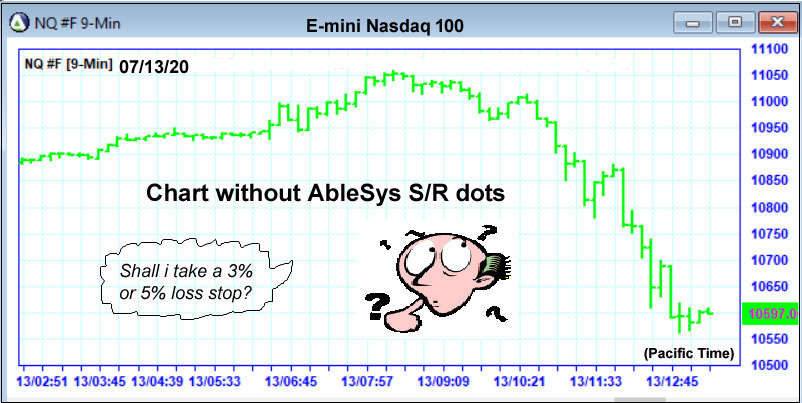
You have entered a market and are holding a position. But now the market is moving against you. Is this current move a retracement or a reversal? If it is a retracement, it is a temporary pullback, where prices will bounce off support and resume the direction of the original trend. If it is a reversal, prices will break through the support level and continue to move against the original trend. Retracement or reversal? It is a typical question that traders face every day. You wonder:
- Shall I surrender and take the loss?
- If not, how much money am I willing to risk?
- Should I set a stop-loss based on a percentage or dollar loss? How do I choose a percentage or dollar loss that will work?
- What if I take the loss and then the market resumes the trend that I anticipated? Do I re-enter the market?
- How about sticking with my original strategy? Maybe I should hang in there no matter how much drawdown I experience?
- Is there a way that I can identify the support levels when I buy?
Yes, #6 is the most important question! If you knew the true market support levels, you could use them to test market strength. When a market tests the support level, if it cannot penetrate that level but instead resumes the anticipated trend, that movement more likely is just a retracement. If you wanted, you could even add to your position at that time. On the other hand, if the market penetrates the support level and closes beyond it, it is likely a reversal. You would do well to exit the position and cut your losses short. Identifying an objective support level is the key to determining if the current move is a retracement or a reversal. So now we ask, is there a way to identify objective support levels?
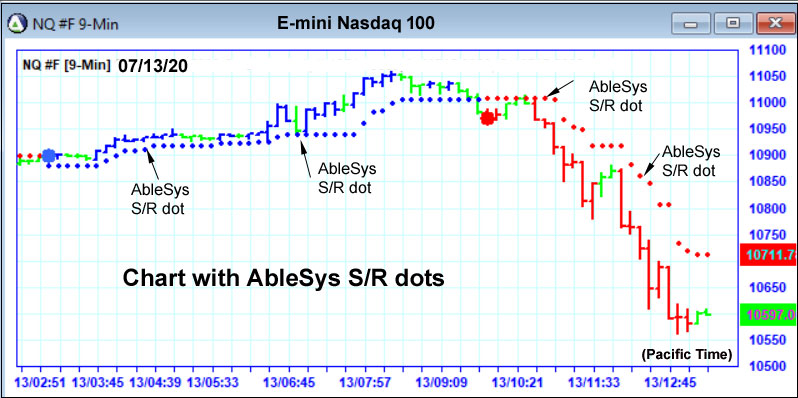
The answer is Yes! AbleSys support dots provide objective support levels by blue dots placed below the price bars; AbleSys resistance dots provide objective resistance levels by red dots placed above the price bars, so that well defined S/R levels are at your fingertips. AbleSys S/R dots offer the following advantages:
- AbleSys S/R dots are defined by the market’s own support levels and are therefore 100% objective.
- The scientific calculations behind AbleSys S/R dots are universal, not curve-fitted.
- AbleSys S/R dots can be back-tested to reveal the characteristics of individual markets.
- AbleSys S/R dots are updated with each new tick so there are no delays
- AbleSys S/R dots are proprietary, not shareware and are for the exclusive use of software owners.
- Successful AbleTrend users around the world have relied on AbleTrend stops. Their common conclusion: “Never fight AbleSys S/R dots”
Charts Without and With AbleSys S/R Dots


With the help of AbleSys S/R dots you can now:
- Have a scientific measure for support and resistance levels.
- Use AbleSys S/R dots to better distinguish retracements from reversals.
- Add more position after the market tests but does not penetrate the AbleSys S/R dots and then resumes the original trend.
- Exit the market when prices penetrate AbleSys S/R dots, suggesting a reversal of the trend.
- Back-test the market you are trading and learn the traits of the market by seeing how it behaved in the past.
- Identify support and resistance levels without delay and without the trouble of doing your own calculations. AbleSys S/R dots are visual and at your fingertips.
- Boost your confidence, “because you have seen it hundreds of times” in both historical and real time. Without confidence, no matter how great your systems are, they are of no practical use.
- Take advantage of “sweet spot entries” by entering the market right after prices have tested AbleSys S/R dots and resumed the original trend. These entry points are low risk entries.
The market is always changing, but the way AbleTrend works remains unchanged. Once you see it work time and time again, you will know that you can rely on it and utilize it. That is the value of the legendary AbleTrend S/R dots. The method is timeless. AbleTrend can help you thrive in today’s volatile markets.

